How to calculate mean and standard deviation in pandas with example
In this tutorial, you will learn how to calculate mean and standard deviation in pandas with example
Mean(): Mean means average value in stastistics, we can calculate by sum of all elements and divided by number of elements in that series or dataframe.
Formula mean = Sum of elements/number of elements
Example : 1, 4, 5, 6, 7,3
Mean = (1+4+5+6+7+3)/6
Mean = 4.333333
Pandas has inbuilt mean() function to calculate mean values. You can calculate for entire dataframe or single column also.
Syntax : DataFrame.mean(axis=None, skipna=None, level=None, numeric_only=None, **kwargs)
Parameters:
axis : {index (0), columns (1)}
skipna : boolean, default True
Exclude NA/null values when computing the result.
level : int or level name, default None
If the axis is a MultiIndex (hierarchical), count along a particular level, collapsing into a Series
numeric_only : boolean, default None
Include only float, int, boolean columns. If None, will attempt to use everything, then use only numeric data. Not implemented for Series.
import pandas as pd

data = pd.DataFrame({ 'name':['ravi','david','raju','david','kumar','teju'],

'experience':[1,2,3,4,5,2],

'salary':[15000,20000,30000,45389,50000,20000],

'join_year' :[2017,2017,2018,2018,2019,2018] })

#To calculate total mean

print(data.mean())

#to calculate mean for specific column

print(data['salary'].mean())
Output:
experience        2.833333
join_year      2017.833333
salary        30064.833333
dtype: float64
30064.833333333332
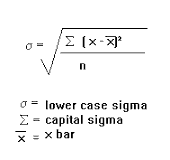
Standard deviation (): The standard deviation measures the spread of the data about the mean value. we can calculate standard deviation by sqrt of variance it will give some measure about, how far elements from the mean.
Example : 1, 4, 5, 6, 7,3
Mean = (1+4+5+6+7+3)/6
Mean = 4.333333
We can calculate standard devaition in pandas by using pandas.DataFrame.std() function.
Syntax: DataFrame.std(axis=None, skipna=None, level=None, ddof=1, numeric_only=None, **kwargs)[source]
Return sample standard deviation over requested axis.
Normalized by N-1 by default. This can be changed using the ddof argument
Parameters:
axis : {index (0), columns (1)}
skipna : boolean, default True
Exclude NA/null values. If an entire row/column is NA, the result will be NA
level : int or level name, default None
If the axis is a MultiIndex (hierarchical), count along a particular level, collapsing into a Series
ddof : int, default 1
Delta Degrees of Freedom. The divisor used in calculations is N – ddof, where N represents the number of elements.
numeric_only : boolean, default None
Include only float, int, boolean columns. If None, will attempt to use everything, then use only numeric data. Not implemented for Series.
Returns:
std : Series or DataFrame (if level specified)
#Standard deviation example program
import pandas as pd

data = pd.DataFrame({ 'd1':[1, 4, 5, 6, 7,3]})

#To calculate total mean

print(data.std())
Output:
d1 2.160247
dtype: float64
